The number of new displacements associated with weather extremes could more than triple to around 22 million by the end of 2019.
Policymakers have for years relied on a get-out clause in the climate change forecasting that implied that current emissions would be removed from the atmosphere by negative emission technologies, and that we’d somehow restore the climate to an agreeable state for life on Earth.
The report from the WMO delivered today at COP25 offers no such salvation. The reality of high impact global events - drought, ecosystem collapse, forest fires, disrupted weather, ocean acidification, cyclones, floods and much more - are up on us. Temperatures are now at ~1.1ºC above the preindustrial period and atmospheric CO2 topped 407.8 parts per million in 2018.
The ocean has been storing over 90 percent of the excess energy and so masking the dangers posed. Unfortunately the mask is now slipping and we are starting to see an increase in marine heatwaves categorised as “severe” in places like the north-east Pacific.
Indicators
CO2 stays in the atmosphere for centuries, and the oceans for even longer, which is how we know that climate change and all associated impacts are locked in.
The WMO has collected data from a wide range of sources including many national meteorological organisations around the world. The following is a summary of the indicators used to identify the state of our climate.
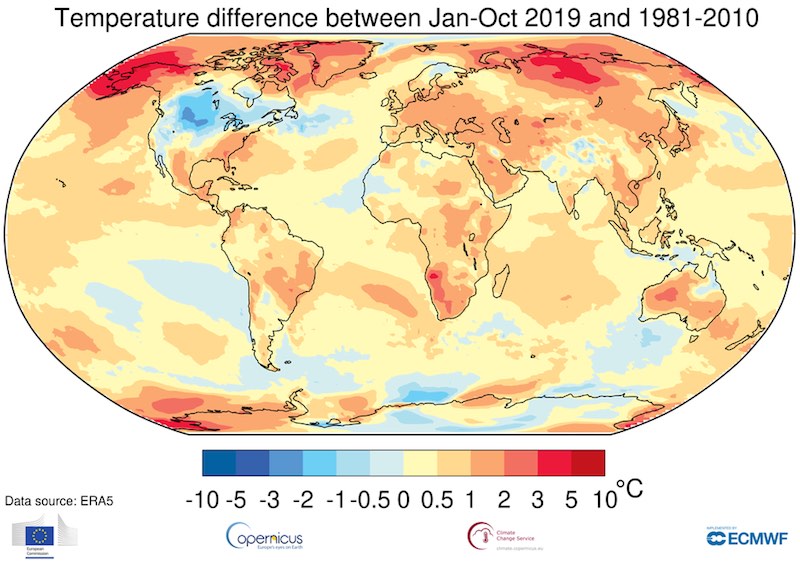
The global mean temperature for the period January to October 2019 was 1.1 ± 0.1 °C above pre-industrial conditions (1850-1900). The five-year (2015-2019) and ten-year (2010-2019) averages are, respectively, almost certain to be the warmest five-year period and decade on record. Since the 1980s, each successive decade has been warmer than the last.
This year, 2019, is expected to be the second or third warmest year on record. 2016, which began with an exceptionally strong El Niño, remains the warmest year.
Large areas of the Arctic were unusually warm in 2019. Most land areas were warmer than the recent average, including South America, Europe, Africa, Asia and Oceania.
Record greenhouse gas concentrations
In 2018, greenhouse gas concentrations reached new highs, with globally averaged mole fractions of carbon dioxide (CO2) at 407.8±0.1 parts per million (ppm), methane (CH4) at 1869±2 parts per billion (ppb) and nitrous oxide (N2O) at 331.1±0.1 ppb. These values constitute, respectively, 147 percent, 259 percent and 123 percent of pre-industrial 1750 levels.
Global average figures for 2019 will not be available until late 2020, but real-time data from a number of specific locations indicate that CO2 levels continued to rise in 2019.
Acceleration of global mean sea level rise
The number of new displacements associated with weather extremes could more than triple to around 22 million by the end of 2019.
The rate of sea-level rise has increased, due partly to melting of ice sheets on Greenland and Antarctica. In October 2019, the global mean sea level reached its highest value since the beginning of the high-precision altimetry record (January 1993).
Ocean heat
In 2019, ocean heat content in the upper 700m (in a series starting in the 1950s) and upper 2000m (in a series starting in 2005) continued at record or near-record levels, with the average for the year so far exceeding the previous record highs set in 2018.
So far in 2019, the ocean has on average experienced around 1.5 months of unusually warm temperatures. More of the ocean had a marine heatwave classified as "Strong" (38 percent) than "Moderate" (28 percent). In the north-east Pacific, large areas reached a marine heatwave category of “Severe”.
Continued ocean acidification
In the decade 2009-2018, the ocean absorbed around 22 percent of the annual emissions of CO2, which helps to attenuate climate change. However, increasing atmospheric CO2 concentrations affect the chemistry of the ocean.
Ocean observations have shown a decrease in the average global surface ocean pH at a rate of 0.017–0.027 pH units per decade since the late 1980s, which is equivalent to an increase in acidity of 26 percent since the beginning of the industrial revolution.
Decline of sea ice
The continued long term decline of Arctic Sea Ice was confirmed in 2019. The September monthly average extent (usually the lowest of the year) was the third lowest on record with the daily minimum extent tied for second-lowest
Until 2016, Antarctic sea ice extent had shown a small long-term increase. In late 2016 this was interrupted by a sudden drop in extent to extreme values. Since then, Antarctic sea-ice extent has remained at relatively low levels.
Greenland ice sheet
Total ice Mass Balance (TMB) for the Greenland Ice Sheet gives a net ice loss for September 2018 to August 2019 of 329 billion tonnes.
To put this into context, data from the Gravity Recovery and Climate Experiment (GRACE) satellites tell us that Greenland lost about 260 billion tonnes of ice per year over the period 2002-2016, with a maximum of 458 billion tonnes in 2011/12.
High impact events
Floods
The Central USA, Northern Canada, Northern Russia and Southwest Asia received abnormally high precipitation. The 12-month rainfall averaged over the contiguous United States for the period for July 2018 to June 2019 (962 mm) was the highest on record.
The onset and withdrawal of the Indian Monsoon were delayed, causing a large precipitation deficit in June but an excess of precipitation in the following months.
Very wet conditions affected parts of South America in January. There was major flooding in northern Argentina, Uruguay and southern Brazil, with losses in Argentina and Uruguay estimated at US$2.5 billion.
The Islamic Republic of Iran was badly affected by flooding in late March and early April. Major flooding affected many hitherto drought-affected parts of east Africa in October and early November.
Drought
Drought affected many parts of southeast Asia and the southwest Pacific in 2019, associated in many cases with the strong positive phase of the Indian Ocean Dipole. Exceptionally dry conditions prevailed from mid-year onwards in Indonesia and neighbouring countries, as well as parts of the Mekong basin further north.
Long-term drought conditions which had affected many parts of inland eastern Australia in 2017 and 2018 expanded and intensified in 2019. Averaged over Australia as a whole, January-October was the driest since 1902.
Dry conditions affected many parts of Central America. It was substantially drier than normal in Honduras, Guatemala, Nicaragua and El Salvador, until heavy rains in October. Central Chile also had an exceptionally dry year, with rainfall for the year to 20 November at Santiago only 82 mm, less than 25 percent of the long-term average.
Heatwaves
Two major heatwaves occurred in Europe in late June and late July. In France, a national record of 46.0°C (1.9°C above the previous record) was set on 28 June. National records were also set in Germany (42.6°C), the Netherlands (40.7°C), Belgium (41.8°C), and the United Kingdom (38.7°C), with the heat also extending into the Nordic countries.
Australia had an exceptionally hot summer. The mean summer temperature was the highest on record by almost 1°C, and January was Australia’s hottest month on record. The heat was most notable for its persistence but there were also significant individual extremes, including 46.6°C in Adelaide on 24 January, the city’s highest temperature on record.
Wildfires
It was an above-average fire year in several high-latitude regions, including Siberia (Russian Federation) and Alaska (US), with fire activity occurring in some parts of the Arctic where it was previously extremely rare.
The severe drought in Indonesia and neighbouring countries led to the most significant fire season since 2015.
The number of reported fires in Brazil’s Amazonia region was only slightly above the 10-year average, but total fire activity in South America was the highest since 2010, with Bolivia and Venezuela among the countries with particularly active fire years.
Tropical cyclones
The Northern Hemisphere, to date, has had 66 tropical cyclones, compared with the average at this time of year of 56, although accumulated cyclone energy (ACE) was only two percent above average. The 2018-19 Southern Hemisphere season was also above average, with 27 cyclones.
Tropical Cyclone Idai made landfall in Mozambique on 15 March as one of the strongest known on the east coast of Africa, resulting in many casualties and widespread devastation.
Idai contributed to the complete destruction of close to 780 000 ha of crops in Malawi, Mozambique, and Zimbabwe, further undermining a precarious food security situation in the region. The cyclone also resulted in at least 50,905 displaced persons in Zimbabwe, 53,237 in southern Malawi and 77,019 in Mozambique.
One of the year’s most intense tropical cyclones was Dorian, which made landfall with category 5 intensity in the Bahamas. The destruction was worsened as it was exceptionally slow-moving and remained near-stationary for about 24 hours.
Typhoon Hagibis made landfall west of Tokyo on 12 October, causing severe flooding.
Climate-related risks and impacts
Health at increasing risk
In 2019, record-setting high temperatures from Australia, India, Japan, and Europe impacted health and well-being. In Japan, a major heatwave event affected the country in late July to early August 2019 resulting in over 100 deaths and an additional 18 000 hospitalizations.
Europe experienced two significant heat waves in the summer of 2019. In June, a heatwave affecting southwestern to central Europe resulted in a number of deaths in Spain and France.
The most significant heatwave was in late July, affecting much of central and western Europe. In the Netherlands, the heatwave was associated with 2,964 deaths, nearly 400 more deaths than during an average summer week.
Changes in climatic conditions since 1950 are making it easier for the Aedes mosquito species to transmit dengue virus, increasing the risk of the occurrence of disease.
In parallel, the global incidence of dengue has grown dramatically in recent decades, and about half of the world population is now at risk of infection. In 2019, the world has experienced a large increase in dengue cases, compared with the same time period in 2018.
Food security continues to be negatively affected
In Southern Africa, the start of the seasonal rains was delayed and there were extensive dry periods. Regional cereal output is forecasted to be about eight percent below the five-year average with 12.5 million people in the region expected to experience severe food insecurity up to March 2020, an increase of more than 10 percent from the previous year.
Food security has been deteriorating in several areas of Ethiopia, Somalia, Kenya and Uganda due to a poor long/Gu rainy season. Overall, about 12.3 million people are food insecure in the Horn of Africa region. Between October and November 2019, Somalia was further affected by intense flooding.
Disasters increase population displacement
More than 10 million new internal displacements were recorded between January and June 2019, seven million being triggered by disasters such as Cyclone Idai in Southeast Africa, Cyclone Fani in South Asia, Hurricane Dorian in the Caribbean, flooding in Iran, the Philippines and Ethiopia, associated with acute humanitarian and protection needs.
The number of new displacements associated with weather extremes could more than triple to around 22 million by the end of 2019.
Will COP25 decide the climate crisis?
The scale of the crisis now demands urgent action and certainly two weeks of negotiations is never going to be enough.
Last year we saw emissions continuing to rise and countries backing away from their Paris pledges.
With climate denial and ignorance displayed with contempt by several key world leaders, the prospects for humanity and for many other organisms do not look good without radical action starting right now.
This Author
Nick Breeze is a climate change writer and interviewer and also writes a great deal about wine. He is an organiser of the Cambridge Climate Lecture Series and Secret Sommelier.